

Ticket Deflection Metrics: How to Prove Your Community Saves Money
Every support team faces the same challenge: too many tickets, not enough time. When customers can’t find answers on their own, they turn to your support team for help, whether it’s a simple “How do I reset my password?” or a more complex technical issue. But what if a significant number of those tickets could be avoided altogether?
That’s where your community comes in. A well-structured support community reduces the burden on your support team by enabling customers to help themselves. The tricky part is proving that impact with data. Leadership doesn’t just want to hear that the community is useful—they want to see how much money it’s saving.
The key to making that case lies in the right metrics. By tracking ticket deflection effectively, you can quantify how many tickets your community is preventing, how much time it’s saving your team, and ultimately, how much it’s lowering your support costs.
What Is Ticket Deflection?
Ticket deflection happens when customers find answers in your community instead of opening a ticket. This happens in two main ways.
- Direct deflection: A user posts a question, and another community member provides an accepted answer. This user gets their solution without involving the support team, resulting in a direct deflection.
- Indirect deflection: A user finds an answer by viewing existing community content, such as discussions or articles, without needing to submit a ticket. While not every pageview leads to a deflection, a portion does. Estimating this count is tricky. Based on our research, around 1 in 5 pageviews on discussions with accepted answers results in a deflection. For general pageviews (e.g., knowledge base articles), about 1 in 20 pageviews leads to a deflection.
Measuring this impact requires looking at the right data. Beyond tracking ticket volume, you have to understand how customers interact with your community and where that leads.
The Core Metrics That Prove Ticket Deflection
Ticket Deflection Rate
The most direct way to measure ticket deflection is by tracking how many customers resolve their issues through the community instead of opening a support ticket.
This can be measured by looking at how many users find a solution in the community and leave without submitting a ticket. If 1,000 customers visit the community in a given month and 600 of them find what they need without escalating to support, your support deflection rate is 60%.
This percentage helps quantify how many issues the community is handling before they ever reach your team. It also shows whether self-service is improving over time. If your deflection rate is rising, it means your community is becoming a stronger resource for customers.
Ticket Volume Over Time
Another way to prove the impact of your community is by looking at overall support ticket trends. If your community is doing its job, ticket volume should decrease as community engagement grows.
For example, let’s say your company handled an average of 5,000 tickets per month before launching its community. A year later, ticket volume has dropped to 3,500 per month. That’s a 30% reduction in support requests, which can be directly tied to self-service deflection.
But to make the case to leadership, you need to go one step further, translating that reduction into cost savings.
Cost Savings From Deflected Tickets
This metric assigns a dollar value to your ticket deflection rate. To calculate it, you first need to estimate how much a deflected ticket saves your organization.
Industry averages suggest a deflected ticket saves $15-$20, though this figure can vary based on factors like support costs and ticket complexity. Adjust these estimates to reflect your own organization’s data.
Here’s a straightforward approach to calculating cost savings, similar to the method used in Higher Logic Vanilla’s ROI calculator:
- Direct deflection savings: Multiply the number of accepted answers by the cost of a support ticket.
- Indirect deflection savings: For pageviews on accepted answers, multiply the total number of pageviews by 1/5 of the ticket cost. For general pageviews (e.g., non-accepted answers or knowledge base articles), multiple the total by 1/20 of the ticket cost.
- Total cost savings: Add together the direct and indirect deflection savings.
- ROI: Divide your total savings by the cost of running the community, then multiply by 100 to get the ROI percentage.
Here’s an example:
If in a given quarter, your community had:
- 300 accepted answers
- 3,000 pageviews of threads with accepted answers
- 10,000 general pageviews
- $15 ticket cost
- A cost of $15,000 to run the community
Your savings calculation would be:
- Direct deflection savings
- Accepted Answers x Cost per Ticket
- 300 answers x $15 = $4500
- Accepted answer pageview savings
- Pageviews on Accepted Answers x 1/5 x Cost per Ticket
- 3000 pageviews x 1/5 x $15 = $9000
- General pageview savings
- General Pageviews x 1/20 x Cost per Ticket
- 10000 x 1/20 x $15 = $7500
- Total savings
- Direct Deflection Savings + Accepted Answer Pageview Savings + General Pageview Savings
- $4500 + $9000 + $7500 = $21000
Your ROI calculation would be:
- ROI= (Total Savings / Cost of Operating the Community) x 100
- ($21000 / $15000) x 100 = 140% ROI
Of course, every community is different, so you’ll want to tweak your deflection rates and cost assumptions to fit your situation. Tools like Higher Logic Vanilla’s ROI calculator simplify this process, allowing you to adjust variables and gain a clearer view of your community financial impact.
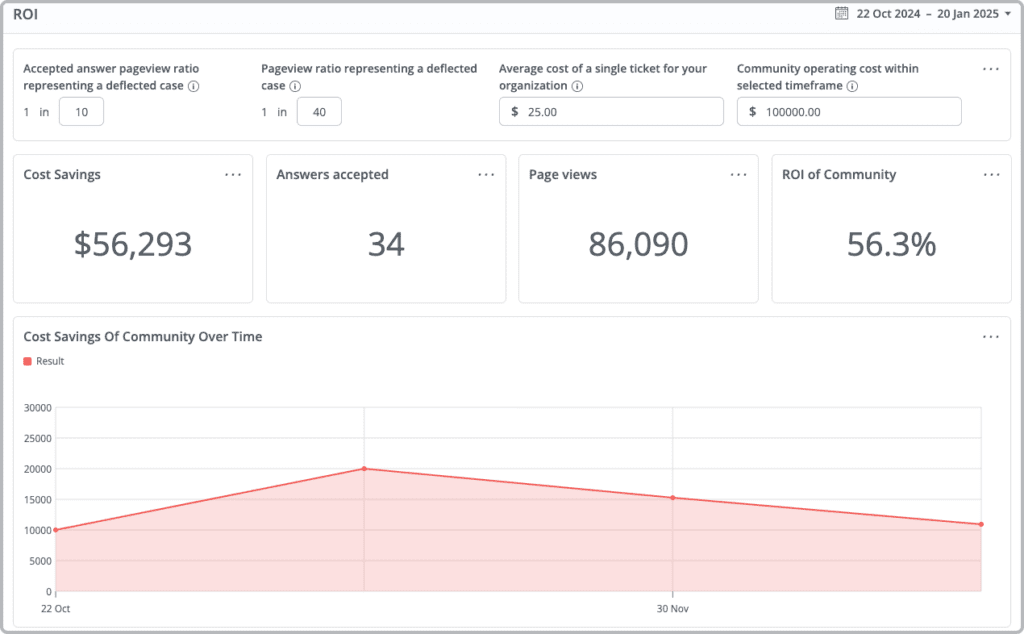
Vanilla’s ROI Calculator Dashboard
Time-to-Resolution (TTR) Improvement
Ticket deflection isn’t just about preventing tickets. It’s also about making the ones that do reach your team easier to resolve. Customers who interact with the community before submitting a ticket tend to have better context, ask more specific questions, and require less back-and-forth with support.
To measure this, compare the average time-to-resolution (TTR) for tickets submitted by customers who engaged with the community versus those who didn’t. If tickets from community-engaged users are resolved 20% faster, that means your support team is handling cases more efficiently, freeing up time for more complex issues.
How to Get Reliable Data
Deflection isn’t a one-size-fits-all metric. Some organizations track direct deflection, measuring how often users find answers in the community instead of submitting a ticket. Others take a broader view, factoring in indirect deflection, where a user engages with self-service content but isn’t easily linked to a resolved issue. The right approach depends on your goals and the data you have available.
Since many customers interact with community content long before deciding whether to submit a ticket, tracking deflection can be tricky. But there are meaningful signals to watch:
- Engagement patterns. If users are searching for help, viewing accepted answers, and upvoting responses—but not opening tickets—it’s a strong sign that the community is resolving their issues.
- Self-service surveys. After users engage with community content, prompt them with a simple question: Did this answer your question? This feedback provides a direct measure of how often community content is resolving customer issues.
- Repeat visitors. A high return rate suggests users trust the community as a reliable resource. But if they keep submitting tickets after visiting, it may indicate gaps in content quality or discoverability.
By tracking these signals, you can move beyond assumptions and build a more accurate picture of how your community contributes to ticket deflection.
How to Present These Metrics to Leadership
Even with strong data, proving the value of a support requires telling a compelling story. Leadership isn’t as concerned with engagement metrics as they are with cost savings, efficiency gains, and customer satisfaction.
Start by framing the community as an extension of your support team. Instead of hiring additional agents to handle growing ticket volume, the community is scaling your support efforts without increasing headcount.
When presenting metrics, connect them to business impact:
- Instead of just saying, “Our community deflects 30% of support tickets,” say, “By preventing 1,500 tickets per month, we’re saving the company $22,500 in support costs.”
- Instead of reporting, “Users find answers in the community 60% of the time,” say, “Six out of ten customers resolve their issues without ever contacting support, reducing workload and improving customer satisfaction.”
Visuals help make the case stronger. Graphs showing the correlation between increased community activity and decreased ticket volume are more impactful than spreadsheets full of numbers.
Most importantly, tie the data back to business goals. If leadership prioritizes cost savings, highlight the financial impact. If they focus on customer experience, emphasize how the community speeds up resolution times and empowers users to help themselves.
Using Support Deflection Data to Improve Your Community
Knowing your community is deflecting support tickets is just the start. The real opportunity is using that data to make your community an even stronger support resource.
If you see that most deflected tickets come from certain types of questions, invest in more content around those topics, whether that’s pinned discussions, knowledge base articles, or video tutorials. If assisted deflection is high, where customers still submit tickets after engaging with the community, look at how you can close the gap. Maybe it’s improving search functionality, surfacing accepted answers more clearly, or encouraging top contributors to refine responses.
Beyond cost savings, these insights can also influence product decisions. If the same troubleshooting questions come up repeatedly, that’s a sign of friction that could be addressed with better UX, clearer documentation, or new product features.
For a full breakdown of which support metrics to track and how to measure them, get the Community Metrics Guide. It’ll help you connect the dots and show the real impact of your community.